How to use the mapping tool
How to use the mapping tool
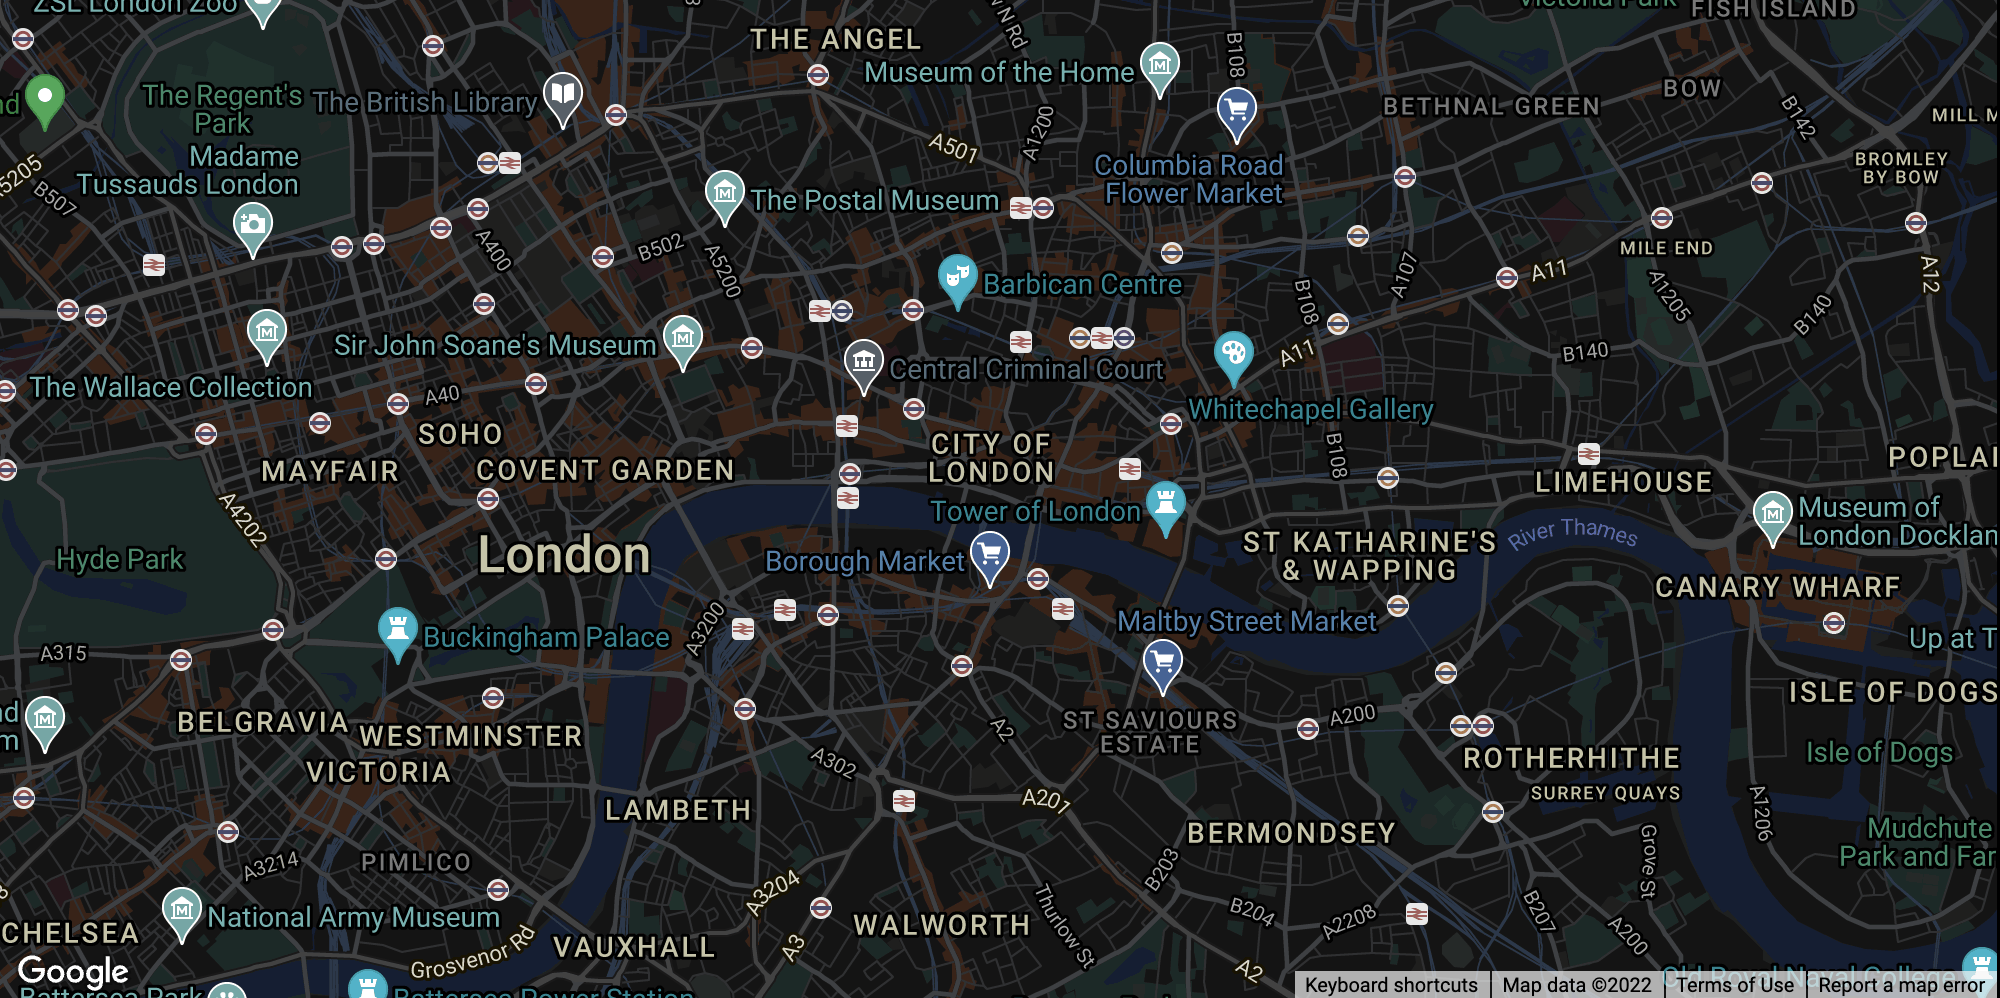
Access the Mapping tool and navigate the map such that it shows the city/area that you plan to use for geographic profiling. Then press the  button.
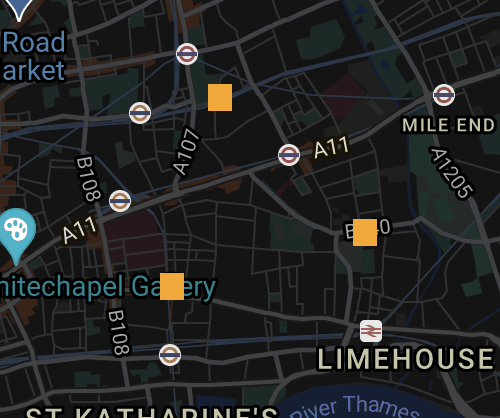
With the button on, you can now select the spots where the criminal has already committed crimes. The selected spots will be coloured orange. Next, press the  button.
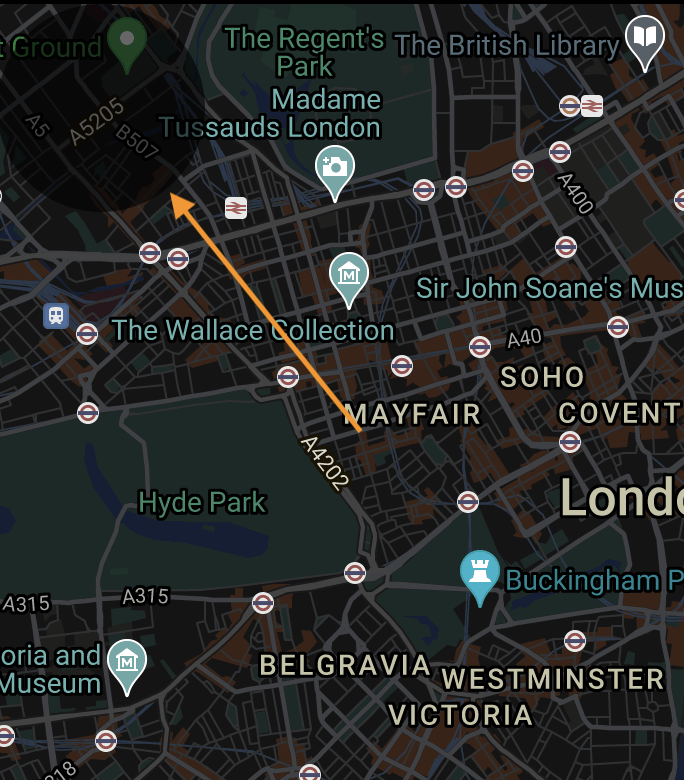
The base of the criminal is likely to be outside a buffer surrounding each crime. You can enter the radius of this buffer by using the  slider. You can press the button to see a circle which is a visual representation of the buffer entered. This circle can be moved around the map for better estimations. In most cases, the buffer radius is unique to the criminal and is often to be determined beforehand.
The value of 'f' controls how fast the probability decays beyond the buffer zone while the value of 'g' controls how fast it decays inside the buffer zone. These values are often unique to the criminal and to be determined beforehand. A value of 0.67 is set as default for both.
After selecting crime locations, setting a buffer radius, and setting 'f' and 'g' values, you can press the  button to show the resulting map.
Reading the results
Squares coloured yellow have a good probability of being the criminal's base.
Squares coloured orange have a high probability of being the criminal's base.
Squares coloured red have the highest probability of being the criminal's base.
Note that after getting the results, you can still change the buffer radius, 'f' and 'g' values and generate new results by pressing the button again after making the changes.